14 Sep 2026
How Data Analytics Shape Operational Decisions at Unlimited-Stake Gaming Venues
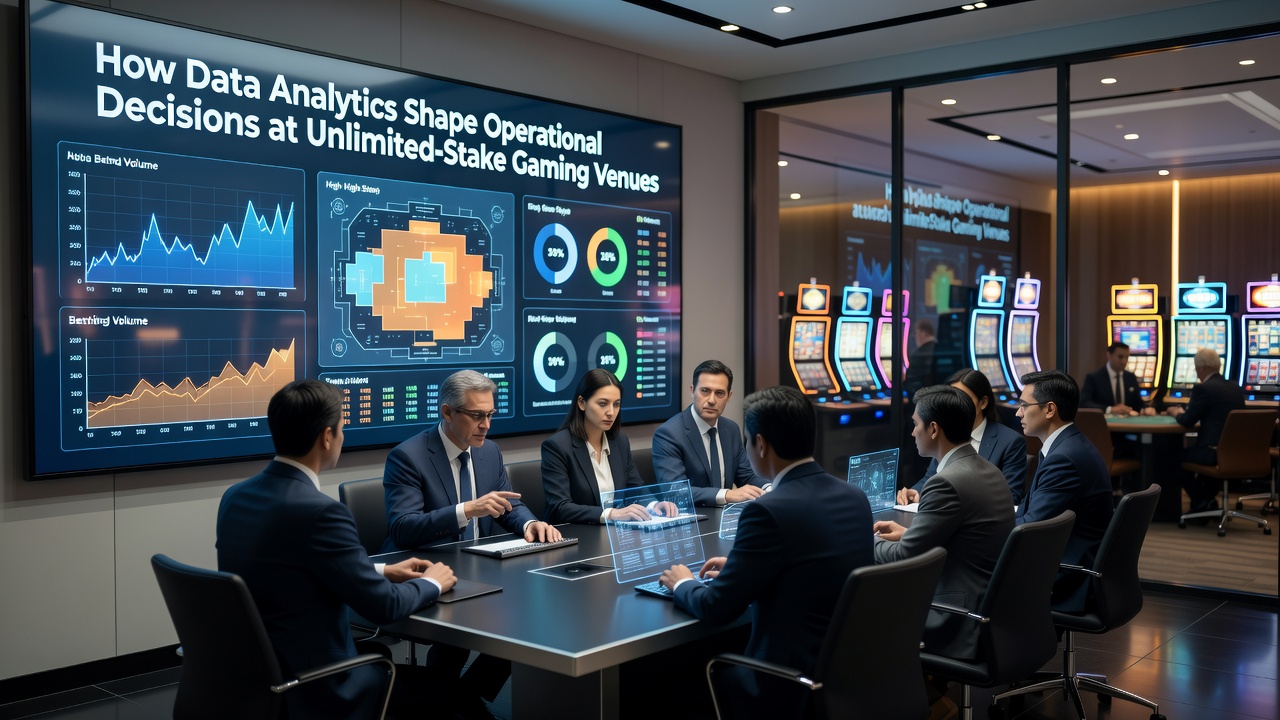
Unlimited-stake gaming venues rely on extensive data streams to guide daily operations, from floor layouts to staffing patterns, and analytics platforms process information collected through player cards, table sensors, and transaction logs. These systems aggregate details on bet volumes, session durations, and game preferences, allowing operators to adjust resources without relying solely on manual observations. Research from the University of Nevada, Las Vegas indicates that venues handling high-limit tables integrate predictive models to forecast peak activity periods, which in turn influences decisions on table minimums and dealer assignments.
Core Data Inputs in High-Limit Environments
Player tracking systems capture every wager above certain thresholds, recording not only amounts but also timing and game type, while surveillance feeds supply visual confirmation of table dynamics. Transaction data from cage operations and digital wallets adds layers on deposit patterns and withdrawal frequencies. According to reports from the Nevada Gaming Control Board, such combined datasets enable venues to identify loyalty segments that generate disproportionate revenue, prompting targeted retention protocols rather than broad promotions. Venues in this category often maintain dedicated analytics teams that cross-reference these inputs with external economic indicators like regional tourism figures.
Player Behavior Modeling and Floor Adjustments
Algorithms process historical patterns to predict when high-value patrons are likely to arrive or switch games, and operators use these projections to reconfigure table spreads in advance. One study tracking multiple North American properties found that real-time heat maps derived from sensor data led to a measurable shift in table occupancy rates during evening hours. Staff then receive alerts through mobile dashboards, allowing them to open or close stations based on live occupancy rather than fixed schedules. This approach connects directly to inventory management for chips and cards, since predicted volumes determine how much stock moves from secure storage to active play areas each shift.
Risk Assessment Through Pattern Recognition
Fraud detection modules flag deviations from established player baselines, such as sudden changes in bet sizing or unusual game selection sequences, and compliance officers review these alerts before escalating to regulatory notifications. Data from the Casino Regulatory Authority of Singapore shows that integrated analytics reduced response times to potential collusion incidents by correlating multiple table feeds with account histories. Beyond security, these same tools evaluate credit extension risks by modeling repayment histories against current play velocity, which informs decisions on marker limits issued at the cage. Observers note that venues applying these models maintain tighter control over exposure while still accommodating the rapid decisions required in unlimited-stake settings.
Resource Allocation and Staffing Optimization
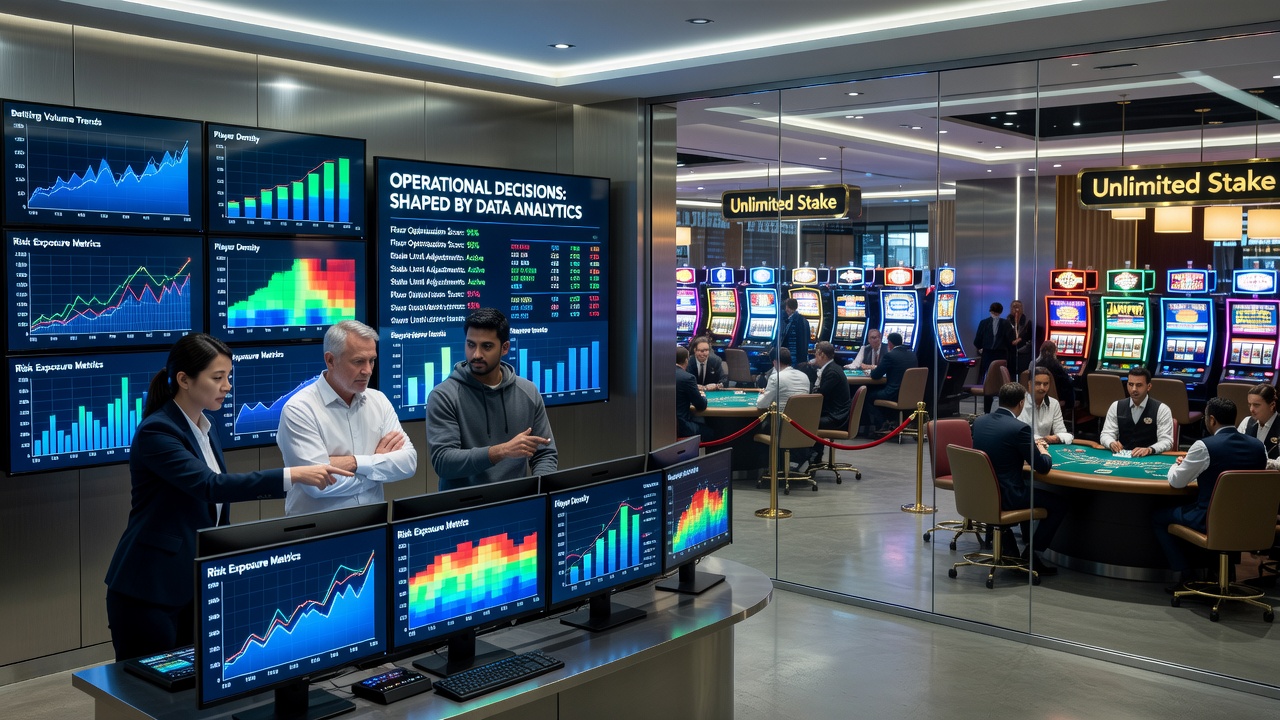
Workforce management software draws on aggregated session data to project labor needs across dealer pits, security posts, and hospitality stations. Rather than applying uniform staffing ratios, planners adjust coverage based on forecasted table utilization and expected duration of high-stakes sessions. Figures released by the American Gaming Association reveal that properties incorporating these models experienced fewer instances of understaffed high-limit areas during major events. Maintenance schedules for gaming equipment also follow data-driven cycles, with sensor readings on machine uptime guiding preventive interventions before downtime affects revenue tables.
Marketing and Promotional Targeting
Segmentation models divide patrons into cohorts according to lifetime value and recency metrics, enabling direct offers tied to individual play histories instead of generic incentives. Email and on-property notification systems trigger when analytics detect a drop in visit frequency among top-tier players, and redemption rates for these personalized incentives feed back into the same models for refinement. In September 2026, several properties plan to test cross-property data sharing agreements that would extend these targeting capabilities across regional networks while maintaining compliance with data protection statutes.
Regulatory Compliance and Reporting Automation
Automated reporting pipelines compile required disclosures for oversight bodies, pulling from the same operational datasets used for internal decisions. This integration reduces manual compilation errors and provides auditors with traceable data lineages. Canadian provincial regulators have documented improved audit outcomes at venues that maintain unified analytics repositories covering both financial and behavioral metrics. The process also supports internal policy reviews, since trend analysis highlights areas where house rules may need adjustment to align with observed player conduct.
Conclusion
Data analytics now serve as the connective tissue between disparate operational functions at unlimited-stake venues, linking player insights to staffing, security, and marketing actions through shared platforms. As sensor technology and modeling techniques advance, the granularity of available inputs continues to expand, supporting more precise adjustments to daily procedures. Venues that maintain robust data governance frameworks position themselves to respond to shifting market conditions with measurable precision rather than reactive measures.